Intelligent Resolution Profiling: A New 3D LUT Creation Method
By Joel Barsotti and Tom Schulte
Modern digital displays exhibit a number of non- linear color rendering errors that can be corrected only with a 3D lookup table (LUT) of color correction values. There are currently two fundamentally different methods in use for creating the display correction values.
In this paper we outline the two current methods and introduce a new method of creating 3D LUT correction values, which combines elements of the two current methods. We describe how this new method of 3D LUT creation produces more accurate results with a more efficient process and adds a level of flexibility and ease-of-use not currently available with either current method.
3D LUT Creation Methods
Two major methods have been in use for collecting display performance information and creating a 3D lookup table of correction values for a display. This 3D LUT data is used to correct the display’s luminance and color rendering performance throughout its three-dimensional color gamut.
These methods of creating 3D LUT correction data differ in their ease of use, their linearity correction accuracy, and the efficiency of their process.
Static Profiling Method
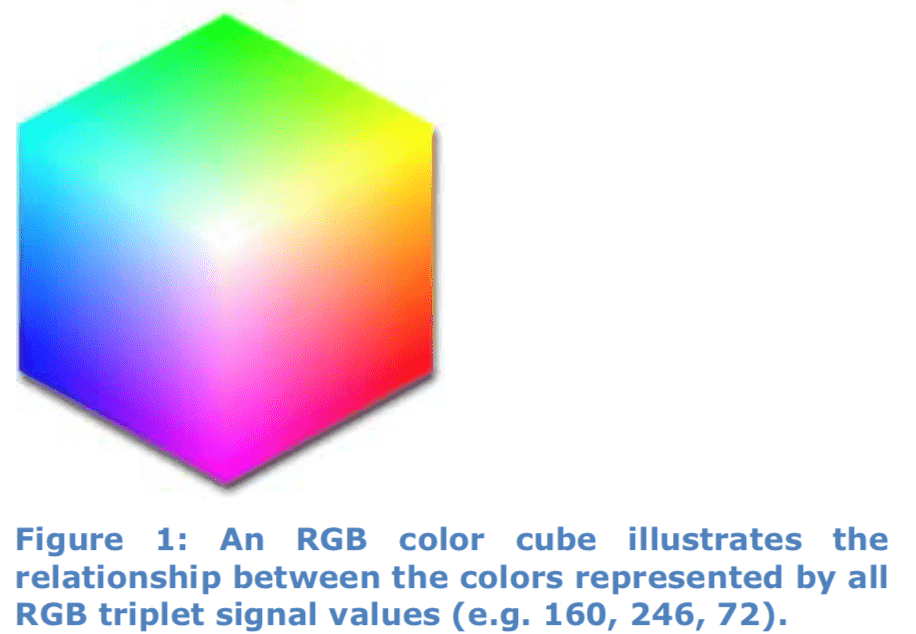
The earliest method of creating 3D LUT correction data is a static process of characterizing a display’s performance throughout its color gamut with a series of color measurements. These measurements are performed at evenly spaced grid points throughout the RGB signal cube (figure 1).
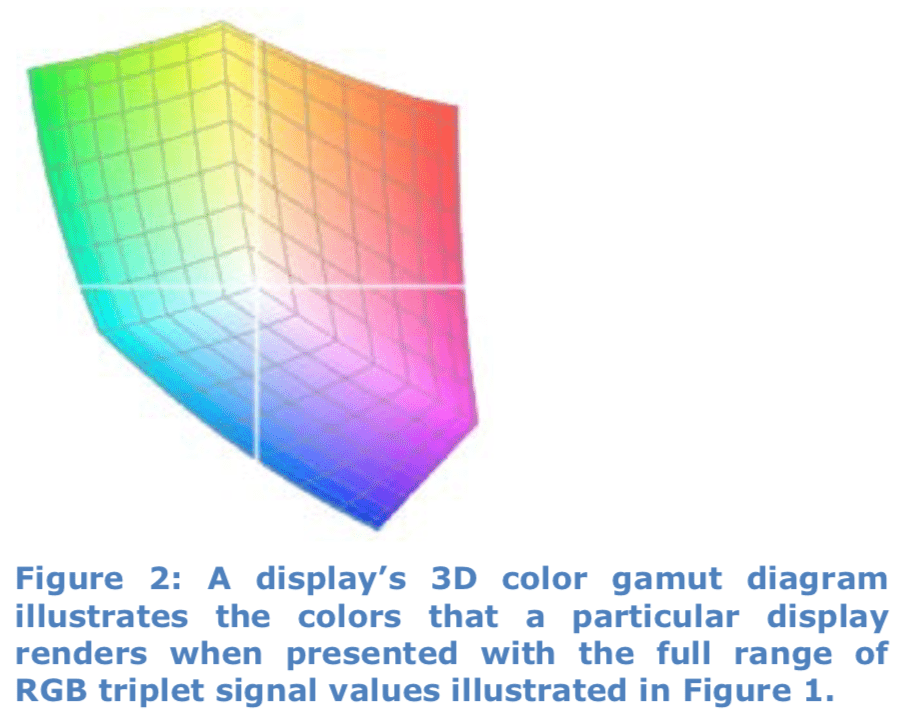
A commonly used grid size is 17x17x17, with 17 levels each of red, green, and blue being added together in all combinations to create 4,913 test colors. This array of test colors is distributed throughout a display’s three-dimensional color gamut (figure 2).
In static profiling, the predetermined test colors are rendered on a display under test and measured with a color meter. The measured values are then compared to the target values for those colors, to develop correction values for each of the color points. The data is saved to a lookup table as a three-dimensional array of color correction data for the tested display.
This display characterization method is static in that the test colors are predetermined, without dynamically adding test colors during the process to areas of a display’s gamut that are found to be nonlinear, needing more detailed error correction data.
In more recent days, it has been determined that 17x17x17 color measurement points are often insufficient to correct the nonlinearities exhibited by modern displays. It has been found that the static profiling process often needs to measure at least 21x21x21 (9,261) color points to provide a desired level of display correction.
As an option to this method, prior to measuring a static profile, an initial analysis can be run with another product to determine a display’s linearity throughout its color gamut. Color gamut areas with greater linearity errors are identified and extra test points are manually added to the static profile process within those nonlinear gamut areas.
Iterative Calibration Method
A later method of creating 3D LUT correction data was developed that produces optimized correction values for each selected test color. This is an iterative process, where each color is measured, then immediately corrected and measured again to detect nonlinear corrective effects, until the optimum correction value is determined for each color point.
Because optimum linearity correction values are immediately developed for each measured color point, each point can then serve as a perfect linear anchor for interpolating correction values for the surrounding non-measured color points. This iterative method of optimizing color anchor points allows fewer color points to be measured and still achieve a desired level of final correction accuracy.
A later enhancement of the iterative calibration method, called Dynamic Linearity Correction™ (DLC), automatically adds color optimization points in those areas of a display’s color gamut that are found to have the greatest linearity errors. After an initial set of color points is optimized (mostly at the outside surface of the color gamut), linear interpolation is performed to predict what colors would be produced, in a perfectly linear display, from the remaining RGB signal values.
As the remaining color points are then measured and optimized, the DLC function compares each point’s initial measured value to its predicted linear value, to determine the amount of display nonlinearity at each color point. At color points that exceed a selected error threshold, extra color optimization points are added in that nonlinear area of the color gamut.
This dynamic process is repeated with the added color points, automatically adding more points outward until the boundaries of each nonlinear gamut area are just reached, totally optimizing each of the display’s nonlinear color areas to the selected level of accuracy.
The DLC function allows a majority of the display calibration points to be allocated to the display’s nonlinear color gamut areas. Thus Dynamic Linearity Correction further increases the efficiency of the iterative calibration method, producing greater overall display accuracy for a given number of measured color points.
Intelligent Resolution Profiling™
The newest method of collecting display performance information and creating a 3D lookup table of correction values combines the legacy method of static display profile measurements with the proven Dynamic Linearity Correction algorithm.
This new Intelligent Resolution Profiling (IRP™) method, first available in Calman version 5.4.0, provides two important benefits over previous 3D LUT creation methods.
- Higher calibration efficiency
- The new 3D LUT process requires fewer color measurements than either previous method to achieve a desired level of display calibration accuracy.
- Calibration flexibility and user-friendliness
- A user can select a time limit that he or she wishes to devote to a 3D LUT calibration and the IRP process will create a display calibration with the highest accuracy possible within that selected time.
IRP Process
When Calman initiates its new IRP process, it first presents a setup dialog to the user to select a desired calibration completion time. Calman then measures about 400 display colors to define the structure of the display’s rendered color gamut; along the RGB signal cube edges, on the cube faces, and within the cube interior.
- Signal Cube Edges
- Red, green, and blue luminance points from each of the fully saturated primary colors to black.
- Cyan, magenta, and yellow points from each of the fully saturated secondary colors to white.
- Color points from the fully saturated red, green, and blue primary colors to their adjacent fully saturated cyan, magenta, and yellow secondary colors. These color points cover all the outside edges of the RGB signal cube. This gamut edge data is crucial for accurately mapping color points in a display’s native gamut that may be outside an intended target color gamut.
- Signal Cube Faces
- Sixteen fully saturated color points on each of the six surface faces of the RGB signal cube.
- Signal Cube Interior
- Grayscale luminance points within the cube, along the interior line from the white point to the black point.
- Primary and secondary color saturation ramp points within the cube, from each fully saturated RGBCMY color to its equal luminance point on the interior grayscale line.
From these initial color measurements, the Calman Dynamic Linearity Correction algorithm uses linear interpolation to predict the colors that would be produced, by a perfectly linear display, from the next sample set of 300-400 RGB signal values. Calman then measures that set of color points and the DLC function compares each point’s measured value to its linear predicted value, to detect the degree of nonlinearity at each color point.
At color points that exceed a preset DLC error threshold, Calman then adds adjacent measurement points in that color area, repeating the process until each nonlinear area of the display’s gamut is fully sampled with measurement points.
Measurement Time Limit
From the initial measurements, Calman determines how long each measurement takes (driven by color meter and pattern source variables). From the first set of DLC sample colors, it also projects the total number of linearity correction points that would be dynamically added during a complete profile at the preset error threshold, if there were no time limit.
From the results of this initial sample set, DLC runs a heuristic analysis to evaluate the degree of linearity error that can be corrected within the selected time limit. Calman then automatically resets the DLC error threshold to the level that it has calculated will result in the achievable number of calibration points in the given time.
This automatic DLC threshold setting allows Calman to add measurement points in the most nonlinear areas of the display gamut, to take optimal advantage of the allocated measurement time.
The IRP process then proceeds to measure the remaining color points and create an optimized 3D table of display correction data. Calman writes the final set of color gamut error data to a profile log file, to a 3D LUT software output file, and to a hardware LUT device, if connected.
The linearity error correction data that IR ProfilingTM produces is the highest accuracy conversion from the measured native gamma and color gamut to the desired target gamma and gamut, given the available measurement time.
Conclusion
A new method for creating a 3D lookup table of display correction values is now available in Calman that is more efficient, accurate, and user-friendly than previous methods. This new method of Intelligent Resolution ProfilingTM allows a user to select a desired time window for creating a 3D LUT.
The IRP process makes an initial set of measurements, evaluates the degree of linearity error that can be corrected within the selected time limit, and automatically sets the DLC error threshold at the level that it has calculated will result in the achievable number of calibration points within the given time limit.
This new 3D LUT calibration method allows Calman to create 3D LUT correction data that most efficiently corrects a display’s gamma and gamut linearity errors within an available period of time.