Starting with Calman 2024 R6 (Ultimate or Studio, v5.15.6), it is now possible to visualize the three-dimensional color volume of a given display in a two-dimensional view called Gamut Rings. Traditionally CIE 1931 or CIE 1976 chromaticity diagrams that offer a two-dimensional perspective have been used. Calman’s Gamut Rings layout provides a way to visualize three-dimensional gamut volume as a series of rings in two dimensions. By industry standard, CIEL*a*b colorspace is used. By industry standard, the CIE L*a*b* color space is used. Since this color space provides some predictors of color appearance (lightness, chroma, and hue), it allows us to quantify gamut volume in perceptually meaningful ways. A display’s white point changes how color is perceived so comparisons are made to the same illuminant (D50 in the device-independent colorspace).
The CIE L*a*b* gamut rings layout measures 602 points and calculates color gamut volume. What matters for a display is how much of a reference color space you can reproduce when receiving a particular video signal. Gamut Rings conveys how well covered the reference gamut is that is being targeted. High luminance capability doesn’t always equate to a high color brightness performance.
Setup
The Gamut Rings layout is part of the CIE L*a*b* Color Volume section of the Calman Color Volume Analysis Workflow (Calman Menu > Open Workflow Template > Analysis)
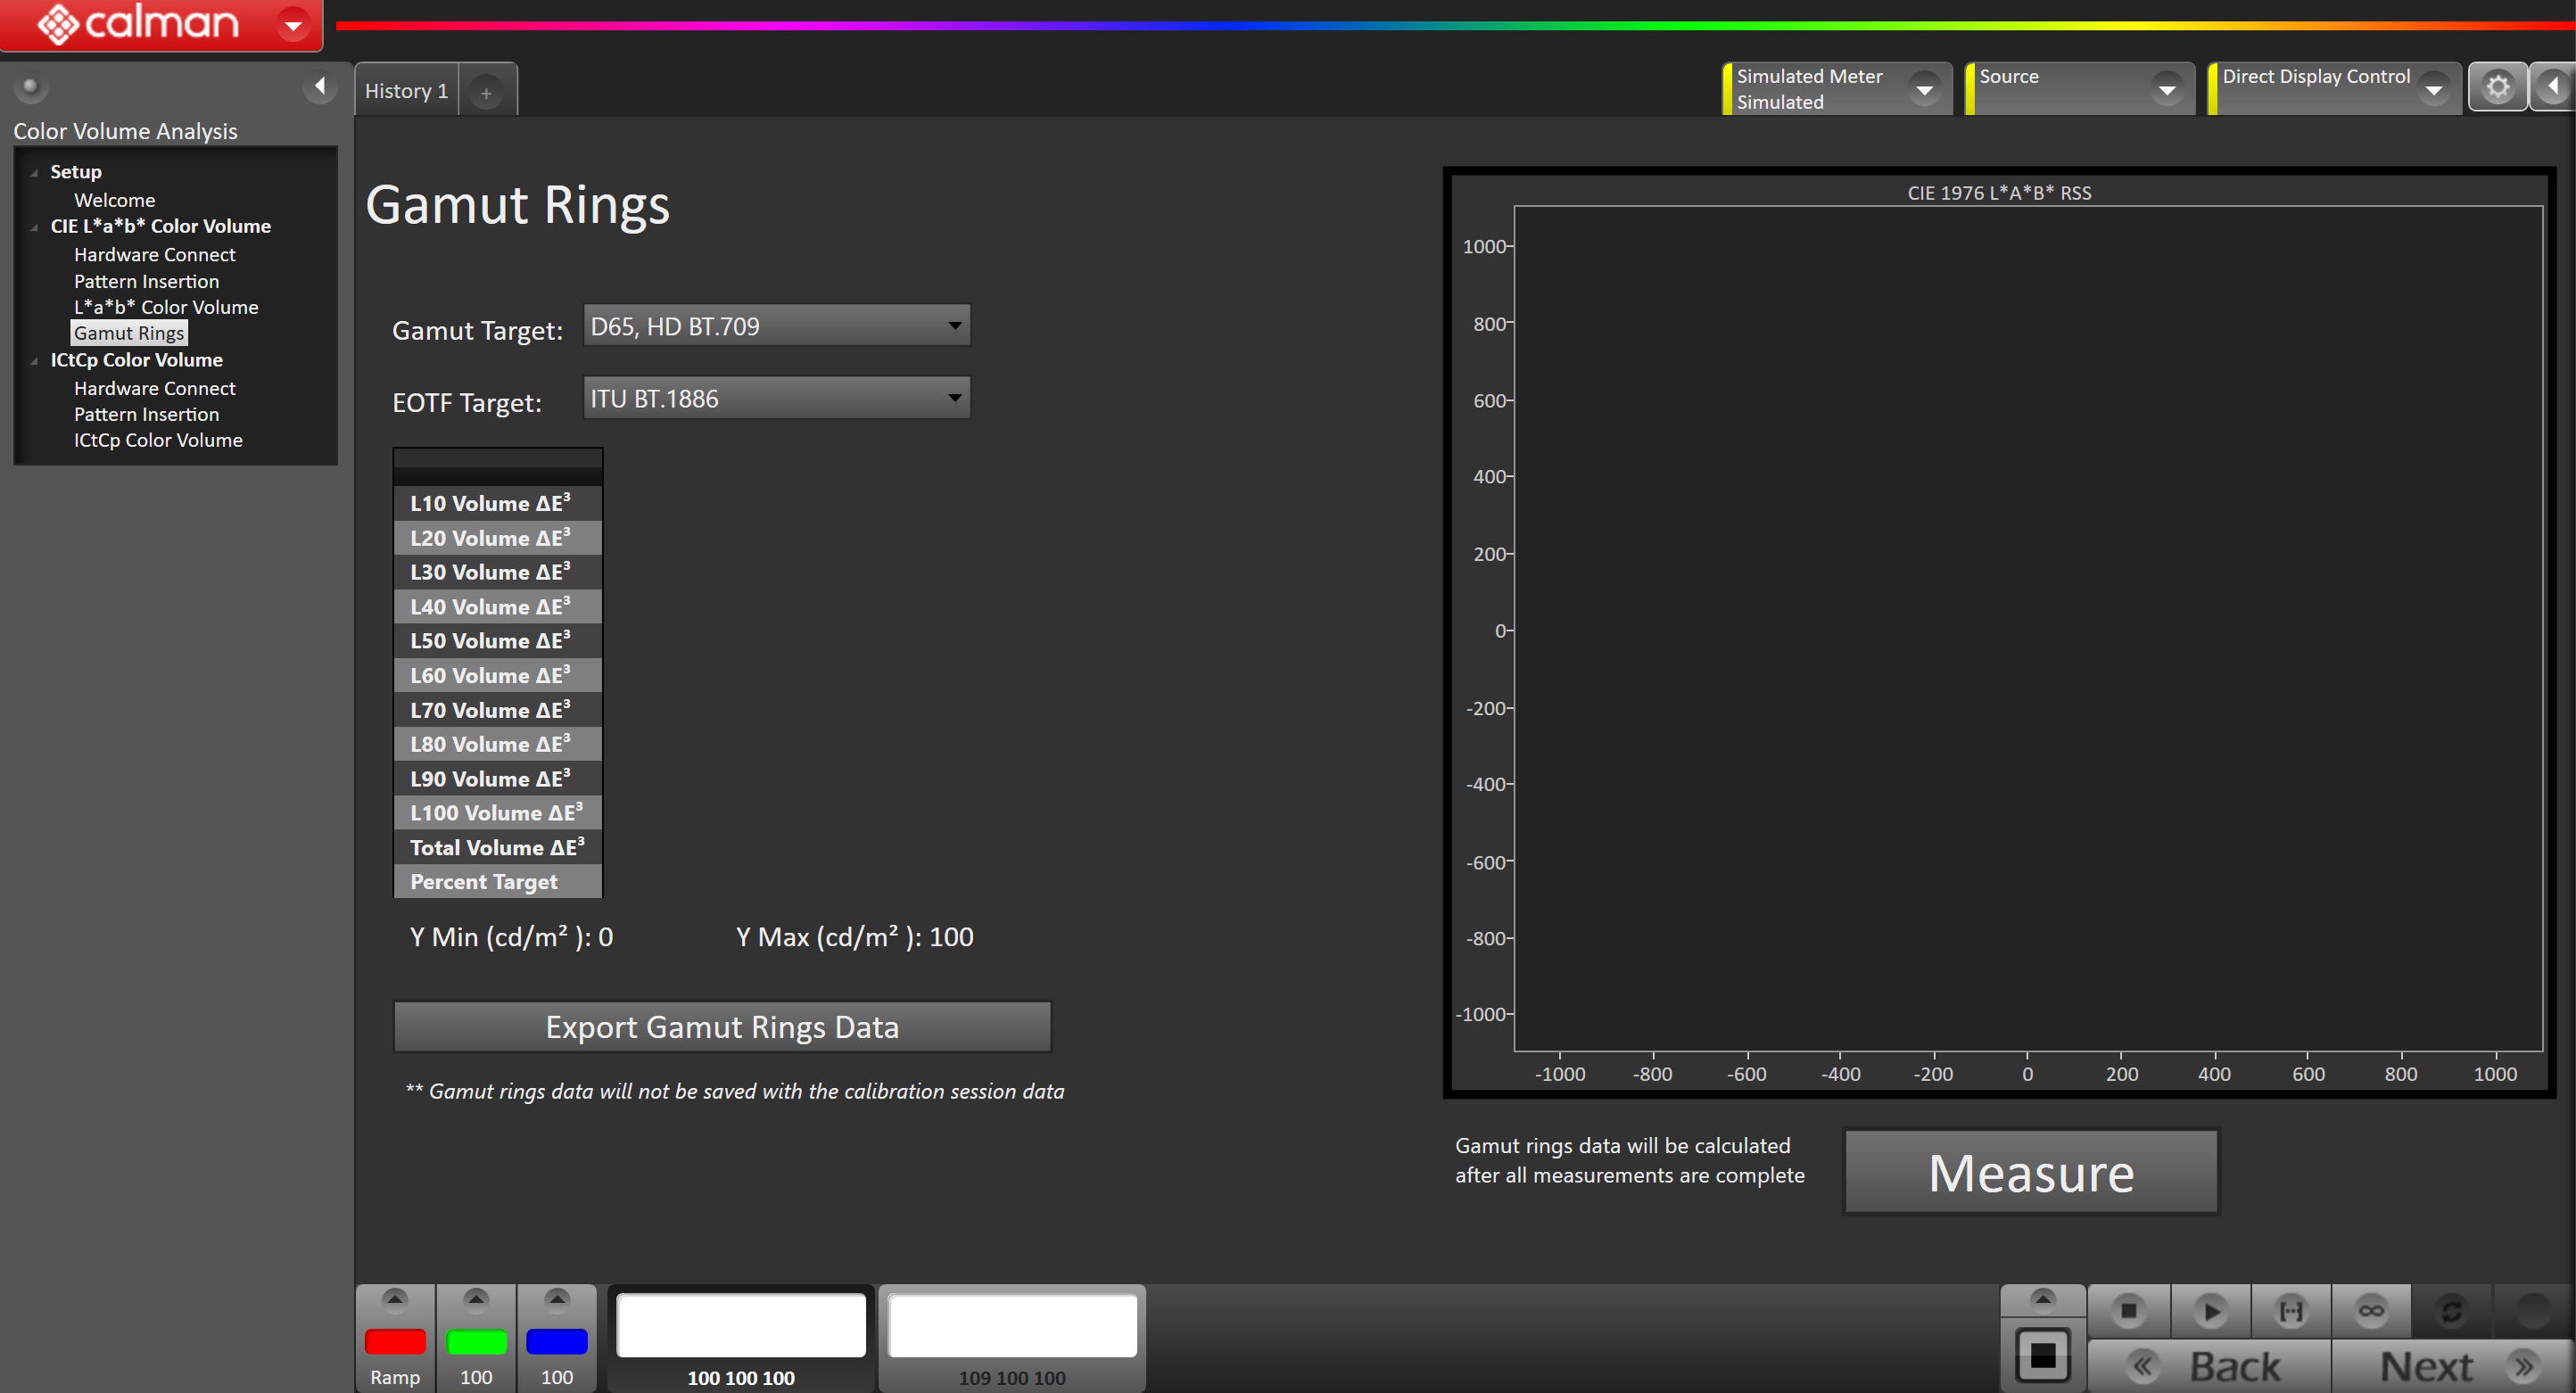
- Set Workflow Gamut & EOTF Target
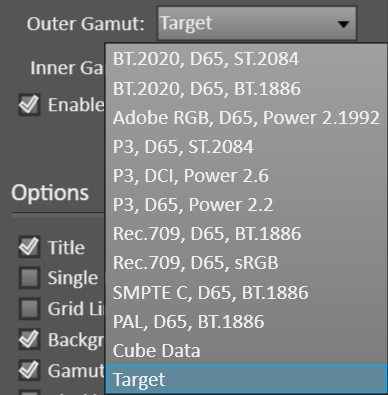
- Gamut Target – Click on the drop-down button to select a target color space
- EOTF Target – Click on the drop-down button to select a target EOTF
- Measure
- Click the measure button to capture data for your display source used for gamut rings comparison. By default, 602 patches will be measured.
- (Optional) Export Gamut Rings Data
- Click on the “Export Gamut Rings Data” button to export your captured data.
- Note: Gamut ring data will not be saved with the calibration session data as of 5.15.6
- Click on the “Export Gamut Rings Data” button to export your captured data.
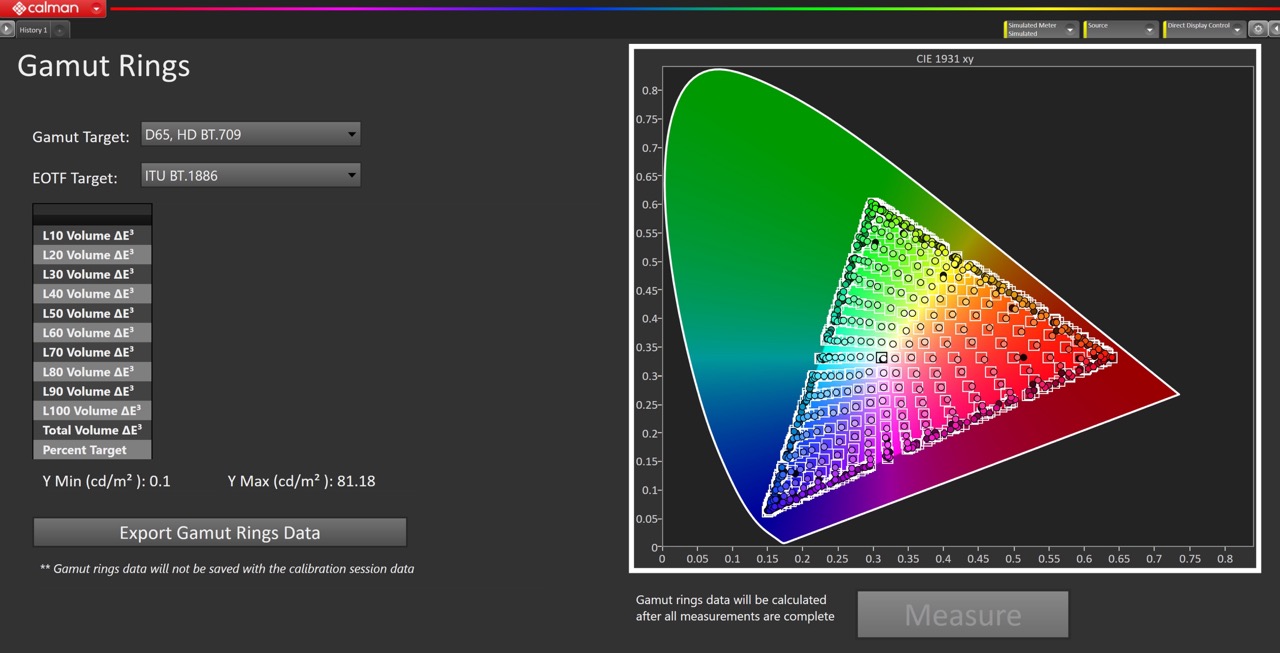
Upon clicking on the Measure button CIE 1931 xy plotting will be shown before the calculated Gamut Rings chart gets generated:
Gamut Rings Chart
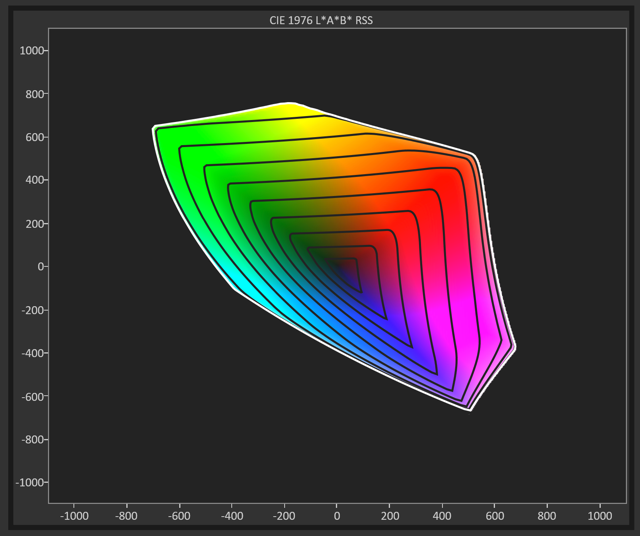
Evaluation is achieved via the device-independent CIE L*a*b* color space with D50. 3D charts are difficult for communication as a different perspective of the same chart can tell a different story. Our screens are after all flat. Gamut rings convey 3D chart information in a 2D format by stretching each slice into a 2D area that corresponds to that region’s portion of the 3D volume. Gamut Rings is simple to interpret: The ring area equals color gamut volume.
- A standardized b*RSS , a*RSS range is used for comparative assessment between color spaces
- By default, Gamut Rings is set to “Overlay Ring Plot” for an easy comparison to a reference. The intersection between the measured data and target is shown with the reference gamut plotted in grey and superimposed on top of the color rings to indicate performance.
The volume of the color gamut is illustrated with 10 lightness L* slices where 0-10L* is represented by the innermost ring. The last ring represents the slice from 90 – 100L*.
The diagram itself is configured so that visual cues to the scale of the color gamut volume can be drawn between various gamuts from display sources when compared on this layout.
The gamut rings chart provides information about color capability within the overall size of a display’s gamut.
Chart Properties
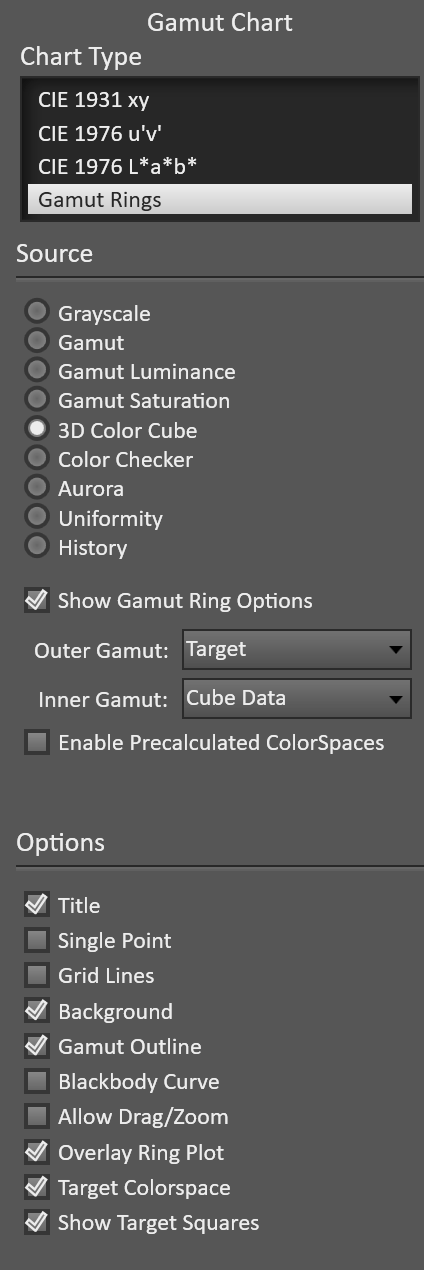
- Show Gamut Ring Options
- After toggling this property you can define the inner and outer gamut source for comparison. By setting the outer or inner gamut to “Cube Data” equates to using measured data, and Target to the color space and EOTF workflow targets
- Enable Precalculated ColorSpaces
- Check this property to select from a variety of pre-calculated options. Useful for comparing reference spaces against each other.
- Overlay Ring Plot
- Uncheck to see the Gamut Rings plot with the reference Target being added as a dotted line next to the ring plot.
- Allow Drag/Zoom
- Check to zoom into/out the graph. Note: Impression of scale will get lost if you divert from the standard range
Gamut Rings Data
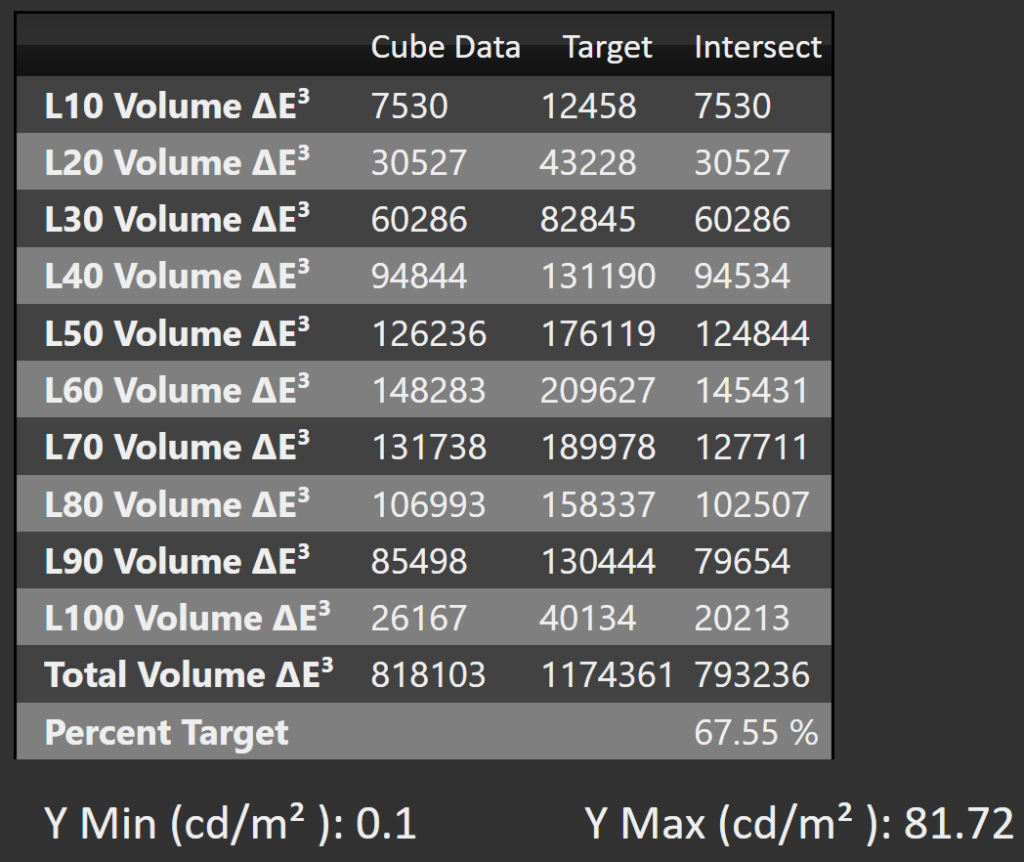
- The measured color gamut volume is reported in ΔE³ units and shown for the 10 L* slices and total volume, for Cube Data, Target and the Intersection.
- If a different inner/outer gamut is selected the column titles will update
- The intersected color volume coverage is shown for the Percent Target row
- Black and White level is given to provide context for the data that was captured
Export Gamut Rings Data

- Click on the Export button and select save
Note: Gamut rings data is not saved with the calibration session data as of 5.15.6